
Cross-Tab/Matrix Feature in XML Publisher
A matrix (crosstab) report contains one row of labels, one column of labels, and information in a grid format that is related to the row and column labels. In other words, a matrix report displays the data in a grid. A distinguishing feature of matrix reports is that the number of columns is not known until the data is fetched from the database.
A simple matrix report might look like the one below, where the jobs are fetched dynamically for the first row and the departments are fetched dynamically for the first column. The salaries of the employees with the job in a particular department are places along the grid. The aggregate totals are displayed in the last row and last column.
|
Dept |
Analyst |
Clerk |
Manager |
Total |
|
10 |
1300 |
2450 |
3750 |
|
|
20 |
6000 |
1900 |
2975 |
10875 |
|
30 |
950 |
2850 |
3800 |
|
|
Total |
6000 |
4150 |
8275 |
18425 |
Cross-Tabs are covered under advanced report layouts in XML Publisher. It would be helpful to first read the XMLP basics before continuing with cross-tabs.
XMLP Basics Reference Link: XMLP Basics
Cross-Tabs feature in XML Publisher is synonymous to Matrix reports in Oracle Reports 6i. I will first explain the example given in XML Publisher User Guide under the section "Creating RTF Template > Advanced Report layouts> Cross-Tab Support". The RTF template given in user guide doesn’t give the desirable results, so I will explain how the code should be modified to get the correct results.
XML Data File:The following is the xml data file used for our example. The xml data file contains the quarter sales results of different industries over a period of time. I have slightly modified the data such that there are no quarter sales results for “Home Furnishing” industry for the year 2003.
<ROWSET>
<RESULTS>
<INDUSTRY>Motor Vehicle Dealers</INDUSTRY>
<YEAR>2005</YEAR>
<QUARTER>Q1</QUARTER>
<SALES>1000</SALES>
</RESULTS>
<RESULTS>
<INDUSTRY>Motor Vehicle Dealers</INDUSTRY>
<YEAR>2005</YEAR>
<QUARTER>Q2</QUARTER>
<SALES>2000</SALES>
</RESULTS>
<RESULTS>
<INDUSTRY>Motor Vehicle Dealers</INDUSTRY>
<YEAR>2004</YEAR>
<QUARTER>Q1</QUARTER>
<SALES>3000</SALES>
</RESULTS>
<RESULTS>
<INDUSTRY>Motor Vehicle Dealers</INDUSTRY>
<YEAR>2004</YEAR>
<QUARTER>Q2</QUARTER>
<SALES>3000</SALES>
</RESULTS>
<RESULTS>
<INDUSTRY>Motor Vehicle Dealers</INDUSTRY>
<YEAR>2003</YEAR>
<QUARTER>Q1</QUARTER>
<SALES>2500</SALES>
</RESULTS>
<RESULTS>
<INDUSTRY>Home Furnishings</INDUSTRY>
<YEAR>2005</YEAR>
<QUARTER>Q1</QUARTER>
<SALES>1200</SALES>
</RESULTS>
<RESULTS>
<INDUSTRY>Home Furnishings</INDUSTRY>
<YEAR>2003</YEAR>
<QUARTER>Q1</QUARTER>
<SALES>1500</SALES>
</RESULTS>
</ROWSET>
http://www.apps2fusion.com/training_demo/kishorer/cross_tab/QUARTER.XML
From this xml we will generate a report that shows each industry and total the quarter sales by year as shown in the following figure:

Template from the User Guide:
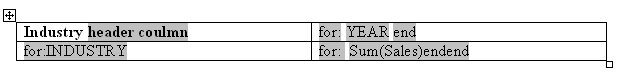
The template to generate this report is shown in the following figure.

You can download the template from this link
http://www.apps2fusion.com/training_demo/kishorer/cross_tab/sample_rtf.rtf
The form field entries are shown in the subsequent table.

Using the above template, the report will display the data as below.

But the output we get using the template mentioned in the user guide is not proper, we didn’t have the quarter sales results for the year 2004 but the value 1500 which has to be shown under 2003 column is actually shown under 2004.
The reason for the erroneous result is, if the cell value (or results of the industry for a year) doesn’t exist, the cell value would be null. As the cell value is null, the table cell is getting collapsed and the actual values are shown side by side. To overcome the problem, we have to check if industry has results in that year or not.
So to overcome this problem, we have to check if industry exists in that year or not. This can be done, by storing the industry value in a local variable and use this value to compare to the value under the INDUSTRY element if at all it exists for a year. If the values are same, the quarter sales result is displayed under the year else a null value is displayed. By including the null value in the table cells even if the industry element doesn’t exist for a year, the correct values are displayed.
Storing of industry value is done in for field field before INDUSTRY form field. Below is the form field code snippet:
<?for-each-group@section:RESULTS;./ INDUSTRY?>
<?variable@incontext:IND;INDUSTRY?>
In the above code, I’m storing the industry name i.e INDUSTRY in variable called IND.
Now when I display the corresponding quarter sales result for a year, I will check if the industry exists for that year using count function. If the year doesn’t exist in industry, I won’t display any value for sales result. This is handled by code:
<?if:count(current-group()[INDUSTRY=$IND])?>
<?sum(current-group()[INDUSTRY=$IND]/SALES)?>
<?end if?>
The above logic is implemented by modifying some of the tags of the template given in the user guide. The modified RTF template can be found below:
http://www.apps2fusion.com/training_demo/kishorer/cross_tab/template2.rtf
Modified RTF template:
The form field entries are shown in the subsequent table. The modified xml tags are shown in bold.
|
Default Text Entry |
Form Field Help Text |
Description |
|
header column |
<?horizontal-break-table:1?> |
Defines the first column as a header that should repeat if the table breaks across pages. 1 in the tag refers the number of columns of the header that should repeat. |
|
for: |
<?for-each-group@column: RESULTS;YEAR?> |
Uses the regrouping syntax (see Regrouping the XML Data, page 2-74) to group the data by YEAR; and the @column context command to create a table column for each group (YEAR). |
|
YEAR |
<?YEAR?> |
Placeholder for the YEAR element. |
|
end |
<?end for-each-group?> |
Closes the for-each-group loop. |
|
for: |
<?for-each-group@section:RESULTS;./ INDUSTRY?> <?variable@incontext:IND;INDUSTRY?> |
Begins the group to create a table row for each INDUSTRY. Store the industry value in a variable IND using variable tag. When displaying the corresponding results for a year, the value in the variable IND is used to compare the value in the INDUSTRY element. |
|
INDUSTRY |
<?INDUSTRY?> |
Placeholder for the INDUSTRY element. |
|
for: |
<?for-each-group@cell://RESULTS;YEAR?> |
Uses the regrouping syntax to group the data by YEAR; and the @cell context command to create a table cell for each group (YEAR). |
|
sum(Sales) |
<?if:count(current-group()[INDUSTRY=$IND])?> <?sum(current-group()[INDUSTRY=$IND]/SALES)?> <?end if?> |
Compare the industry with the value in the variable IND, if the count>0, then it returns TRUE, so the code written inside IF clause executes i.e. Sums the sales for the current group (YEAR) is displayed in the cell. |
|
end |
<?end for-each-group?> |
Closes the for-each-group statement. |
|
end |
<?end for-each-group?> |
Closes the for-each-group statement. |
After the above modifications to the template, the result can be seen below:
For additional reading on “Regrouping the XML Data” and “Using Context Commands”, read the sections "Creating RTF Template > Data Handling > Regrouping the XML Data" and "Creating RTF Template > Advanced Design Options > Using Context Commands" respectively in the XMLP user guide.
You find one more example on cross-tabs here.
RTF Template for that example can be downloaded from here
XML file can be downloaded from here


Comments
This is Rama Krishna Mateti.
How r u doing?
I have developed an RTF template and I inserted Header and Footer in the template.
When I test with the sample XML data for the template I could not able to see the Header and Footer such as Logo, Page Number...etc in the PDF but I could see
the Output in PDF when I run the same template and input XML file in the other Computer.
When I uploaded the template and register it with Oracle Apps I could succesfully see the Header and Footer report along with Output in the PDF File.
Could you tell me do I need to make any modifications/S etting in the MS Word so that I could see the header & footer in the PDF?
Thanks in advance
Go to word and define header and footer by selecting templates and do the alignment. It works fine for me, and able to view page 1 of 1 and repeating header in all the pdf pages.
Save word file as rtf and upload thru xml publisher administrator.
Regards,
Willi am.
I am developing a cross tab report in which I have row header as the year like 2008,2007,2006. ...column header as months jan,feb,mar...a nd the data area contains the respective data...I need to format the background color of the rows and columns which are below the date of the report(report is ran for a particular month like mar-08)..I was able to format the background color of all the rows that fall below(ex:08) the year of the report(using #C0D27F)..
and I need to format the 3(till march) columns in the yr 2008.
If you want to display 0 instead of NULL, sum(Sales) tag needs to be modified to include else tag and print 0.
Kishore
BTW, this is wonderful, wonderful article, written with learner's needs in mind. All sample files dowloadable! Great! Thanks a lot!
Firstly, Thanks for the code and methods. It really helped me.
I also need to sort my columns and data.
For e.g
In the columns for YEAR, I want sort by year ( 2003, 2004,2005 etc.). When I add the "sort" tag to the column header, the column header gets sorted but the corresponding cells still display the old values.
meaning .....after sorting the year is displayed as 2003,2004,2005 but the sales values are still the old.
So, 2003 value for sales will not be correct, it will be for (say)2005.
I hope I am not confusing.
Any help with this sort is highly appreciated.
M any Thanks,
abdulra zak
First of all deeply thanks to give such a good solution.
if possible will you please send me one .rdf file for an example,
I have one .rdf file their am getting some issue will explore that with yours valuable response.
Than ks in Advance.
Regar d's
Md.Khizer
B ahrain
Plea se share your issue with rdf file. You've not specified your email address?
Kisho re
This is a brilliant solution.
It worked for me with almost no changes.
Chand ra
I have build the Cross-tab Report to display user/responsibi lty report , the rport is gicing all the columns and rows when i am going to get HTML layout(in this formate also repot is very big not fit to get print in one page). but when i am going to get PDF of Word the columns are not fit and the columns are spliting down so i am getin the report as table formate with repated data of user info . so please kindly help me in this issue. and i want to know how to decode the info in this XML reports (ex :- decode(user,1,' YES','----')).
Thanks
Raj.
Thank s for nice article. It is helpful for me. I have developed a cross tab report, but not able to print the grand totals in the report.
My requirement like
an example
a b c d e |
1 2 3 4 5 | (15 )
1 2 3 4 5 | (15 )
------------- --------------- -
2 4 6 8 10 (30)
I need to print horizontal total and vertical totals. Could you please let me know how to print the report in the above format.
Thanks
Murali
You can do it with the "Pivot Table" feature of BI Publisher.
I had similar requirement recently, and I did it in the same way.
Follow these simple steps.
1. Load your XML data into your template/rtf
2. Goto -> Insert/Pivot Table
3. Design your Matrix report with the help of wizard.
4. You can preview here, if you want.
5. On this "Pivot table" wizard, under -> properties/Tota l , you can choose your sub-totals by making them true or false.
6. Click OK, then wizard will design your matrix report.
hope this helps.
Thanks,
Chandra Matta
Thanks for providing a good solution.
Can you pls share me the .rdf file for an example that you discussed.
Thanks in Advance.
Dayanand Pachanouri
I forgot the email id: dayanand.pachanouri
Regards, dayanand
For this article, I started with xml data given in xmlp user guide. I don't have rdf with me.
Kishore
I to try sorted the column for dynamic pivot table, that contain the month names in the column. this showing the columns disordered
I need to deliver the same kind of report. But I have multiple groups upon the table,
say group by employee name, project, invoice and then similat cross tab table for expense on differen dates.
when I followed the same procedure with using current-group() , its not working for me. The total is still shifting to left if there are no values for a expense on a day. Cna u help me on this.
Thanks,
Hari.
It is very difficult to program, if there are multiple groups in matrix report.
My sugession is, use "Pivot table" feature of Microsoft Word, while designing your template/RTF.
I installed BI desktop version of - 10.1.3.4 and MS Office/MS Word -2007.
To use Pivot table feature - Goto
>>"Add-Ins" on RTF
>> Insert > Pivot Table.
Do small reaserch and use preview to check how report is coming along etc.
This way it is lot easy than declaring variable/progra mming.
Let me know..
Thanks,
Chandra
I am fighting with BI Publisher. I have a template with a table (it's a kind of matrix) where the columns are VL1, VL2, VL3. The rows are Count with value '1', Count with value '2'. This BI Publisher works with Siebel.
The idea is:
- for each Campaign on the Campaign Applet:
- if the value under VL1 is '1' on the Contact Applet (all contacts for the campaign are shown on the applet):
- Count all the records on the Contact Applet where this condition is met (VL1=1)
- The result is set on the cell of the pair (VL1/Count with Value '1') of the table in my rtf. template.
So, I created the table but by counting, the application counts all records no matter if it equals '1' or not:
----> if VL1 = 1 on my Contact LIst Applet
----> count all records (all contacts on the applet which meets the condition)
Un fortunately it doesn't work, what am I doing wrong? any suggestions?
I would appreciate you, if you could help me..
Best Regards
BIbegi nner
Can any body help on cross tab report with group having having empty cells without data.
thanks in advance
naresh
Industry-- --------------- -----2005------ 2004------2003
Motor Vehicle Dealers----1000 ------3000----- -2500
--------- --------------- ---------2000-- ----3000
Home Furnishings---- ------1200----- --------------1 500
Cell two would then become: .
However, this does not give the desired results. Any ideas?
Thank you.
I have made Matrix report with group through wizard and also created xml .
But I cannot make Rtf file through the word -template bulider for matrix
How can I make the rtf template in this way that i can view my output in excel in the same way as report gives .
can u help me.
I want negative number format, -1.1 --> (1.1).
I make the rtf template and choose Number format in Text Form Field Option is #,##0;(#,##0), but not.
Can u help me.
Ths.
I have to design a template of payslip where there is one earning table and another deduction table need to be placed side by side. My logic is such that based on earning elements, earning table gets populated with data, same with deduction table. I have used current group, choose and when conditions to fetch the data. The template throws error if i place two tables side by side as it is not executing the conditions if they are on same line. If i place the deduction table after earnings table, the logic works.
How to place two tables side by side and make the conditions execute?
please help. It urgent.
G H I
A B C D E F D E F
D E F
A B C D E F D E F
D E F
I am now elaborating the fields: Here A,B,C are static fields for a particular group.G,H and I are header fields which are dynamic with the data.Again D,E and F fields can have multiple rows for a particular combination of A,B,C and F.Whereever there is no data,that row would have to be left blank.Till now I have proceeded to show one row for each A,B,C but I could not bring multiple rows of D,E and F of a particular A,B,C and header(G,H,I) and also could not generate blank rows.Please help me with this.I need it urgently.
-
-
-
ju
01630001325
Polyethylene-Pr otection/Waterp roofing -Sheet , W :408cm , L :1145cm , 500g
Rl
Common
00006
Common.1.A.A3.A 1
104-1
100
-
ju
01630001325
Polyethylene-Pr otection/Waterp roofing -Sheet , W :408cm , L :1145cm , 500g
Rl
Common
00007
Common.1.A.A3.A 2
104-2
200
-
ju
01630001325
Polyethylene-Pr otection/Waterp roofing -Sheet , W :408cm , L :1145cm , 500g
Rl
Tower
00008
Tower.1.A.A3.A2
104-3
300
-
ju
01630001326
Polyethylene-Pr otection/Waterp roofing -Sheet , W :408cm , L :1145cm , 500g
Rl
Common
00008
Common.1.A.A3.A 2
104-3
300
-
ju
01630001326
Polyethylene-Pr otection/Waterp roofing -Sheet , W :408cm , L :1145cm , 500g
Rl
Tower1
00007
Tower1.1.A.A3.A 2
104-2
200
This is the xml data.the output needs to be something like:
Common--header Tower 1--header
Item Code Item Description UOM Tag Locator Lot number QuantityTag Locator Lot number Quantity
static can have multiple rows can have multiple rows
G H I
A--B--C----D-- E--F----D--E--F --------------- -
-----------D-- E--F----------- ------------
A- -B--C----D--E-- F-------------- D--E--F
------- --------------- ----------D--E- -F
I am now elaborating the fields: Here A,B,C are static fields for a particular group.G,H and I are header fields which are dynamic with the data.Again D,E and F fields can have multiple rows for a particular combination of A,B,C and F.Whereever there is no data,that row would have to be left blank.Till now I have proceeded to show one row for each A,B,C but I could not bring multiple rows of D,E and F of a particular A,B,C and header(G,H,I) and also could not generate blank rows.Please help me with this.I need it urgently.
-
-
-
ju
01630001325
Polyethylene-Pr otection/Waterp roofing -Sheet , W :408cm , L :1145cm , 500g
Rl
Common
00006
Common.1.A.A3.A 1
104-1
100
-
ju
01630001325
Polyethylene-Pr otection/Waterp roofing -Sheet , W :408cm , L :1145cm , 500g
Rl
Common
00007
Common.1.A.A3.A 2
104-2
200
-
ju
01630001325
Polyethylene-Pr otection/Waterp roofing -Sheet , W :408cm , L :1145cm , 500g
Rl
Tower
00008
Tower.1.A.A3.A2
104-3
300
-
ju
01630001326
Polyethylene-Pr otection/Waterp roofing -Sheet , W :408cm , L :1145cm , 500g
Rl
Common
00008
Common.1.A.A3.A 2
104-3
300
-
ju
01630001326
Polyethylene-Pr otection/Waterp roofing -Sheet , W :408cm , L :1145cm , 500g
Rl
Tower1
00007
Tower1.1.A.A3.A 2
104-2
200
This is the xml data.the output needs to be something like:
Common--header Tower 1--header
Item Code Item Description UOM Tag Locator Lot number QuantityTag Locator Lot number Quantity
static can have multiple rows can have multiple rows
I have made report with cross tab also works fine but when we submit it in apps it gives an error .
Because Cross tab function is not acceptable for apps so what is the another method to do it properly can u tell me ?
Regards
Hemali
I have a similar cross tab requirement and though the initial version is working the NULL cases comes, it doesnt give a proper output and need some help to fix the issue. Could you please send me you e-mail addrss and I can send you the template & sample XML file that I'm working with. I'm pretty sure that it might be a simple fix but not able to figure (I'm pretty new to XMLP). Would really appreciate your help !!
Thanks
Parent item
–>child line item 1
–>child line item 2
–>child line item 3
So in the rtf/report it will display such as –
Code : child line item 1
child line item 2
child line item 3
But i need to do in this format –
Code :child line item 1,child line item 2,child line item 3
Please advice and email me..Thank you
it works great, i had this problem and your piece of code, works like magic, you are a life save dude :D, please do continue working on objects like these, it does saves my day.
may almighty increase your tribe.
your ardent Fan
Abdulrahma n mohammed
But i got an issue while implementing matrix.
I had a requirement where i display my values in one row, but problem arose when there are same values only one value gets display. How can i rectify it? please help.
I am very glad to find this article. I have simliar XML file as your sample XML file, but the client wants the report to show the data for each quarter.
can you please let me know if this is possible? Thank you very much! Jie Ji
INDUSTRY 2005 2006
Q1Q2Q3Q4Q1 Q2Q3Q4
Pay Month
Jan Feb March Total
Vendor Pay Amount
Ravi 100 100 100 300
In the Above structure I want to include another group called locations in Vendor column,after which the structure will be like below
Pay Month
Jan Feb March Total
Vendor Pay Amount
Ravi 100 100 100 300
----------- --------------- --------------- --------------- -------
Location
Loc1 50 50 50 150
----------- --------------- --------------- --------------- -------
Loc2 50 50 50 150
I have developed a xml report but not able to see the header and footer section.Do I need to do any setup or properties.
Th anks,
Siva.
Thanks for providing this piece of code.
I have used this,but i am getting some issue.
The output of the report is coming in Excel and in SUM(SAL) for some rows NaN is coming and in some rows correct value is getting populated.
This NaN is soem junk value,can you tell me how i can rectify this issue?
Is there any way to design a template which would provide organization chart dynamically?
If so, please do let me know
Thanks in advance
Dev
Suppose I have a table of 4 rows. resulting from cross tab.
I need to display the sum of 3 rows after dislaying those 3 rows.
and my 4th row has a subgroup. I need to display the subgroup total for 4th row
and in the end total of cross table. I need to display ( sum of 3 rows + 4th row result)
Is it possible in cross tab for XML publisher?
i am trying to build cross tab report with multiple colomns in cross tab report.
For ex.
region1 region2
a b c a b c
row 1 data1 data2
how to achieve second level column dynamically. Here columns a b c may change based on data.
Please reply ASAP
I Have created simple Matrix report but I want to create Nested Grouping in Matrix report. Any one give me support to create this type of report.
see desired result.
A_Group Grand Total By Rows
B_Group Total
C_Group D_Group CELL
Total
Grand Total By Columns
Thank s for those who will give me some suggesion
Rega rds
Haq Nawaz
A.F.Fergu son & Co
Pakistan , Karachi
I have created Group matrix report by using pivot table, but when i attached it to Applications, application generate error, so kindly tell me if there another way to do group matrix Report.
Quick response is appreciable.
Regards
Haq Nawaz
A.F.Fergu son & Co
Karachi, Pakistan
ho w can we make group matrix tamplate in word's bi publisher, except Pivot table method.Before it i couldn't create group crosstab like layout. give some example for help
Thanks in advance
Regar ds
Haq Nawaz
A.F.Fergu son & Co
Karachi, Pakistan
Way to Go! :)
But let's say that in the last example there is no data for the year 2004.
the example would build like this:
Indusrtry 2005 2003
Motor vehicle dealers 3000 2500
Home frunishings 1200 15000
What if I still wanted to show the year 2004 within the matrix ( to stress the fact that it is empty)
As there is no data for 2004 it will not appear in the xml.
Does anyone know how to solve this?
Regards,
jorge
Please sugest me How to get the Matrix type report along with the Totals at the bottom. even it is with RTF wizard or XML coding,
Please let me know asap...
Regard s,
karunakar.
Note: here some days Net-Rate is changing for the day more than once.
is it possible by RTF templates?. Please share any RTF template for this type of out put....
TYPEC OPIESMONTUEWEDT HUFRISATSUN
ABC NET-Rate: 1054101531
QTY: 111200100011120 0200300
Amout:1 110100040001110 30000600300
NET -Rate: 124
QTY:1001000
Amout:12004000
BBCNET-: 126212626
QTY:1 005002001003005 00500
Amout:120 030004001200180 010003000
Reg ards,
Karunakar .
i'm a begginer in using oracle xml publisher , i want only to make a template like that
emp_name emp_no emp_address
un der this i need a table contains
manager_name manager_number manager_address
but my problem is , if a specific variable is not null then i need the above layout , if it null i need its reverse which is
manager_name manager_number manager_address
under this i need a table contains
emp_name emp_no emp_address
so , i need a variable grouping depending on a specific variable.
Than ks in advance for your time,
i'm a beginner in Oracle XML publisher and rtf templates, but i only need rtf to be like that if a specific vaiable is not null
Emp_name Emp_no Emp_address
un der this i need a table contains
Manager_name Manager_no Manager_address
but if the specific variable is null i need the rtf to be like that
Manager_n ame Manager_no Manager_address
under this i need a table contains
Emp_name Emp_no Emp_address
so i need variable grouping in each time depending on this variable !!!
Thanks in advance for your time
Mohamed Ibrahim
Oracle Developer
Coca- Cola Egypt Company
My requirement was like this:
Item_No Date Short_Amt
I1 D1 S1
I1 D2 S2
I2 D3 S3
I2 D4 S4
I2 D5 S5
Now My output will be:
Item_No D1 D2 D3 D4 D5
I1 S1 S2
I2 S3 S4 S5
I have converted the rows into columns but now the problem is that for each item the dates are getting repeated.
Outp ut is coming like this:
Item_No D1 D2 D3 D4 D5 D1 D2 D3 D4 D5
I1 S1 S2
I2 S3 S4 S5
Can you plz help me to stop the repeatation of dates????
Than ks in advance........ ......
In continuatation with the previous comment,I want to add that I have made rdf and rtf files with matrix format.
I have the layout with 3 fields - see bellow:
Resume of delivery of Milk by day of periodo (dd/mm) --------------- --------------- --------------- --------------- --------------- --------------- --------------- -
Day Recept. Cond. Day Recept. Cond. Day Recept. Cond. Day Recept. Cond. Day Recept. Cond.
-------- ---------- - --------- -------- ---------- -------- --------------- ---- ----------- ------- --------- ----------- -------- --------- ---------
99/99 99.999 99.999 99/99 99.999 99.999 99/99 99.999 99.999 99/99 99.999 99.999 99/99 99.999 99.999
99/99 99.999 99.999 99/99 99.999 99.999 99/99 99.999 99.999 99/99 99.999 99.999 99/99 99.999 99.999
99/99 99.999 99.999 99/99 99.999 99.999 99/99 99.999 99.999 99/99 99.999 99.999 99/99 99.999 99.999
--------------- ------------------- --------
I get with this for:
But There are many days and the lenght of page doesn't fit. I need break line each 5 days. My print is overflow the width of the page A4.
--------------- ------------------- -------
My doubt is how I get define max number of times I repeat this 3 fields (columns) - each 5 day, I must break and insert a new line with the next days.
--- A C G Martins
Howeve r, I am in need of some further help.
I am trying to create a Purchase Order report that shows the distribution of the items in different branches and I need it to go into page break for every 10 items in the report.
I need the header to be copied in as well since the header has the branches where the items will be distributed (this is dynamic)
I have been trying to incorporate this: apps2fusion.com /apps/21-techni cal/155-xml-pub lisher-developi ng-reports-prin ted-on-pre-prin ted-stationary however it is not working as I had hoped.
I appreciate any insights you may provide with this. Thank you!
I am a fresher in BI Publisher.
As discussed in above post I am also facing the same problem.
I want customer header whch consists of customer name, number, and report title to be repeated in every page of my output PDF format...
Where I need to show in every page. May be page -Break or any other logic.. Kindly help me..
Industry 2005 2004 2003 Average
Motor Vehicle Dealer 3000 6000 2500 11500/3=3834
Ho me Furnishing 1200 1500 2700/2=1350
Average 4200/2=2100 6000 4000/2=2000 5184/2=2592
pl ese help
Thanks & Ewgards,
Mohame d.
rece nt output
aa bb cc dd
a y y n n
b y y n n
c y y n n
d y y n n
output should be
aa bb cc dd
a y y n n
b n y y n
c y n n y
d y y n y
like that.... y, n is symbol...like yes/no
How to Design the Matrix With Group Above in XML Publisher, Its Urgent in my current Project. If you know can you share asap.
Thanks & Regards,
Karuna kar.
Your Document is very helpful.i have one requirement in cross tab please help me how to create cross tab report.
my report format is..
__________ _______
inv |total
org_id | class | item|qty|total
hope u will understand this format.
please provide me solution ASAP.
waiting for ur positive reply
Regard
Su heeb
Tha nks
Very much appreciated any suggestions or solution regarding this.
:)
How do I add the total of the Rows to the Right and Total of Columns to the bottom. Please help.
For ex:
Industry.. ............... ...... 2005..... 2004..... 2003.... TOTAL
Motor Vehicle Dealer..... 3000......6000. .....2500.....1 1500
Home Furnishing..... ..... 1200.......1500 ......0........ ..2700
TOTAL... ............... ....... 4200.......7500 ......2500..... 14200
-This is not working for me.
Please help...
I have developed a xml publisher report which generated cross tab output forllowing the steps given by you.Now I have an additional requirement.
I have this cross tab repeating for each "location" which is the Main group and cross tab is formed for Detail group.The output is given below.
Locati on XXX
1/11/20131/ 18/20131/25/201 32/1/2013
RVK 84
CTR 850102
RVL 234182
WUP 222
TWL 4
XXX Total9 45 27 2
Location YYY
1/11/20131/ 18/20131/25/201 32/1/2013
RVK 84
CTR 850102
RVL 234182
WUP 222
TWL 4
YYY Total9 45 27 2
But here the matrix total is coming correct but the matrix value is diplayed wrong.Asyou see the total for first column 9 but the value sums up to 18. This issue is because of the grouping () If I place current-group I get correct value but i face the issue which you have mentioned in your article .the value will be displayed under wrong column.
How can I overcome this.
Please help
again posting sample output
Locatio n XXX
DATE......1/11 /2013 1/18/2013 1/25/2013
RVK........8.. .........4
CTR........8.. .........50.... ......10
RVL........2.. .........34.... ......18
WUP........... .........2..... ......22
TWL........... ............... ......4
XXX Total 9...........45. ..........27
Location YYY
DATE......1/11 /2013 1/18/2013 1/25/2013
RVK........8.. .........4
CTR........8.. .........50.... ......10
RVL........2.. .........34.... ......18
WUP........... .........2..... ......22
TWL........... ............... ......4
YYYTotal 9...........45. ..........27
Location ZZZ
.
.
.
Thanks
something when null
if:count(current-group()[INDUSTRY=$IND]) = 0
some thing when null
end if
of course use for each line
Emp name - Location - Absence dates for March, 2015
Ramesh - Chennai - 25-Mar-2015 - 26-Mar-2015 - 27-Mar-2015 - 30-Mar-2015 - 31-Mar-2015
(28th and 29th are weekends)
Can you help me how to achieve this.
Thanks in advance
I have tried below options but still unable to get 0 instead of Null
0
0
RSS feed for comments to this post