
Introduction
Most of us have been used to embedding OTBI Analysis into a Dashboard for long but there could be need to have even BI Reports embedded in a Dashboard too.
There are multiple articles, blogposts and whitepapers available on internet which explains how to add a OTBI Analysis into a Dashboard but I guess a comprehensive write up on adding a BI Report is missing.
As such, let-me try to give a decent try and I hope this would be useful.
Pre-Requisites
For this demonstration we would need to have a pre-existing BI Report (which fortunately I have ready with me).
The BI Report output appears as below:

As you can clearly make out this (above) is a screenshot of a BI Report which displays the Employee’s Legal Employer, Business Unit and Department details (as per his/her latest Assignment Record).
Now we would like to have the same report Embedded in a Dashboard.
Creating Custom Dashboard and Embedding BI Report
As a first step one would need to navigate to BI Catalog and create a new Dashboard.
Navigation: Navigator -> Tools -> Reports and Analytics -> BI Catalog->New

Once we click on the “Dashboard” option a New Page will open “New Dashboard” which would ask you for some details like Name, Description, Location ,Content, etc. For this example, we would populate the following details
|
Attribute Prompt |
Attribute Value |
|
Name |
Custom Dashboard with Embedded BI Report |
|
Description |
Custom Dashboard created to demonstrate how to Embed a BI Report |
|
Location |
/Shared Folders/Human Capital Management/ Dashboards |
|
Content |
Add content now |
Once populated the screen would appear as below:

Once we click on “OK” we would land up on a new page which would look as below:
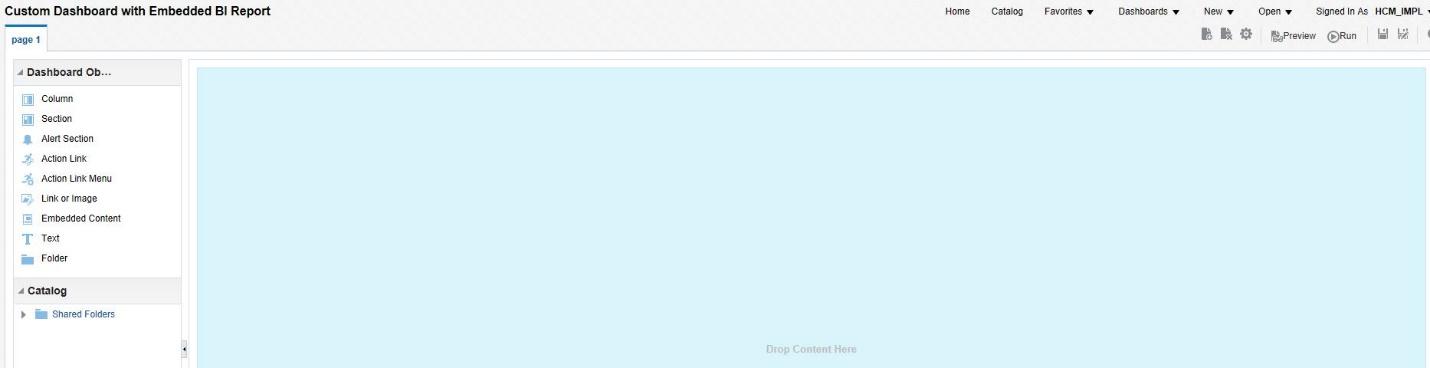
Next we will drop two Dashboard Objects namely “Link or Image” and “Action Link”

Details of the same are in the screen-shot below:

Once done the Dashboard would appear as below:

We can save the Dashboard. And try running the same to check whether it works as expected.
Running the Dashboard
Once we click on “Run” Option on dashboard we will be able to see both the sections (Image and the Link to BI Report)

And now when we click on the Highlighted Text it takes us to the Report location and executes the report

Summary
So this is how we can embed BI Reports in a Dashboard too. While I have just added one BI Report one can add as many as they wish ( make sure the page doesn’t gets cluttered too much ). The ease of understanding should not be compromised so a proper balance should be maintained too. This feature (Embedding Custom BI Content) within a Dashboard is a common feature independent of application modules meaning works for HCM, SCM, Financial, Sales cloud…etc etc.
Also the same is applicable for On-Premise and Hybrid Deployment Model too.
And with this I have come to end of this article, Thanks All for your time and have a nice day!


Comments
RSS feed for comments to this post