While some if not all of us are aware of the OTBI Reports, Dashboards, Prompts and other components, there must be some curious to know how does a dashboard helps when compared to a traditional report.
A dashboard is a fancy way of displaying data with the help of nice pie-charts, bars, numbers, colors and what not and the best part being you need not do something explicit to reach out to them. They are placed on the Homepage, Welcome Page and gives you a quick answer to your questions whether you are a Team Member, Project Manager and CFO/CTO/CIO.
Different individuals working in an organization seek different answers from the system for example:
- Team Member / Employee
Would be interested in knowing about his vacation balance, pending tasks, goals/objectives
- Project Manager
Would be interested in project deliverables, resource availability, project fund
- Resource Manager
Would be interested in most valuable resources, attrition rate, and reasons for people leaving the organization
- CFO/CTO/CIO
Senior Officials/Decision Makers would be interested in which products are doing well in market, which are the most valued customers, past trends, forecasting, budgeting and many more…..
All such information and many others which are needed on a day to day basis are good to be displayed on a homepage or a most frequently visited page (may be delivered using agents too) so that individuals get the information which help them to get their job done smoothly.
These dashboards can be created either as a sub-object within an existing page or can even be embedded in a completely new custom page.
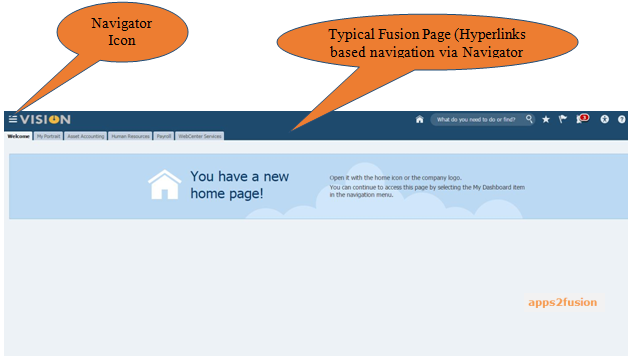
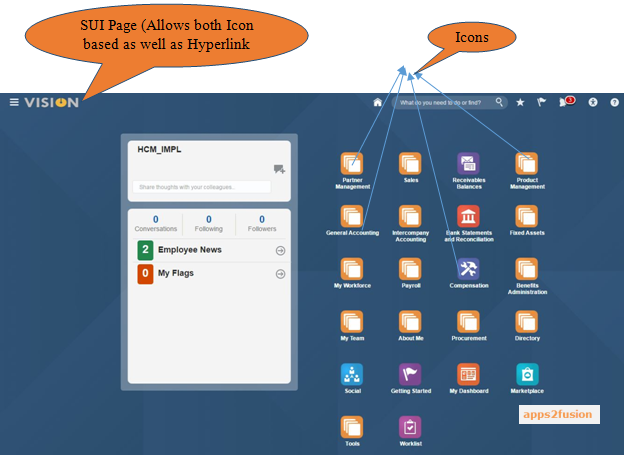
They could be added on the SUI springboards too. To give a brief overview of SUI its stands for Simplified User Interface and as the name suggests it is an alternative link which is mostly used by employees for performing self-service transactions. This particular interface has icons instead of the hyperlinks (of a typical Fusion Environment) which saves a lot of time and effort for end-user to directly navigate to his/her area of interest (by a simple click on icons which are available on homepage). We will try to understand the same (look and feel of a Standard Fusion Page versus a SUI Page) with help of screen-shots below:
This is how a SUI page differs from a typical Fusion one and now coming back to our original topic of discussion about “Dashboard use and its importance” ,while each one of the above mentioned subtopics may be discussed in detail with worked examples and implementation methodologies we will cover one specific worked example here and we will name it as an ‘Employee Engagement’ Dashboard.
This was a novice thought for one of the customers who moved from a traditional ERP System to Fusion Applications and were keen to ensure that their workforce get used to the new system.
Before elaborating more on the same let us try to have a look at the dashboard created and that might help us grasp a better understanding of the same:
- End User View of a Dashboard
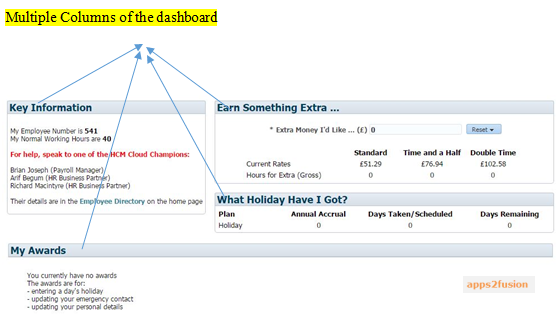
Employee Awards (End User View)
The above dashboard comprises of multiple Dashboard objects and are placed on a same dashboard page by making smart use of columns.
Each one of the object are embedded with a column (a more detailed and clear view being represented in the design view shown below)
- Design View
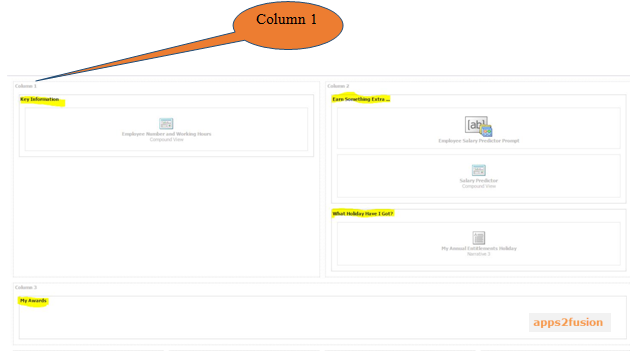
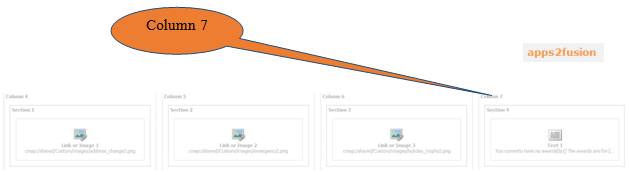
We would just look into detail one of the specific column (Column 7) of the above snap-shot and try to understand the same:
A close look at Column7 reveals its content and they appear as:
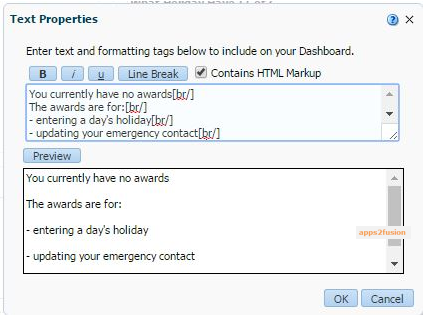
We could see that this particular object is a text object and its properties reveal that ‘This particular type of object allows us to Enter Text and formatting tags to include on the Dashboard”
It has provision of choosing styling (Bold, Italics and Underline as shown) also we may choose whether we need a HTML Markup or not.
There is a preview section too which shows how it would look when on a dashboard.
Each Dashboard Page when in design mode has certain control buttons on top right hand side as shown below:
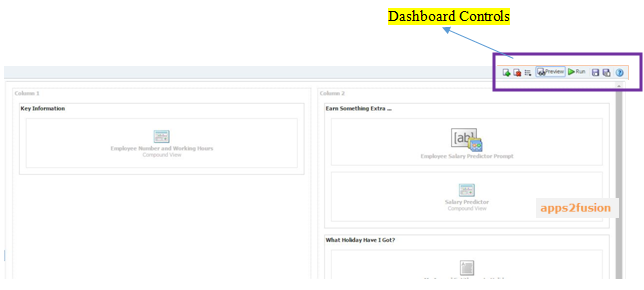
While the icon with (+) sign is for Adding a Dashboard Page, the one with (X) icon is for deleting the same, the list icon ( is a drop down list … options shown in below screen) , preview and run option ( we would look in detail how they work) and lastly the other two icons besides the rightmost (? Icon) which is for help are for saving the dashboard (save and save-as options respectively). 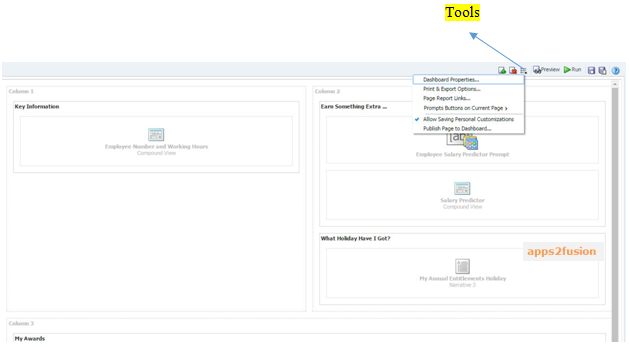
We would now try to click on the preview button to check what its functionality is and as per the name given to it appears it would give a static view of the page:
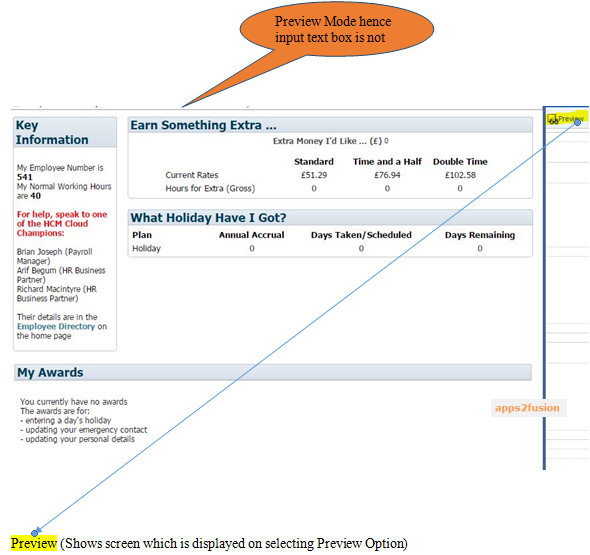
One important point to note here is that in ‘Preview’ mode we do not get any input box where-in we might expect the dashboard page to behave in a interactive way.
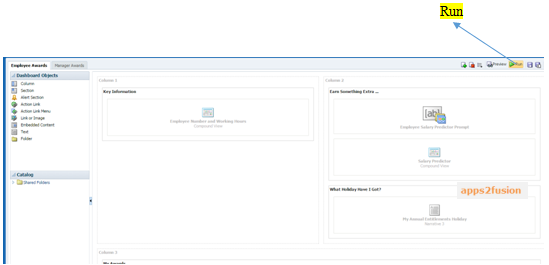
But, when we choose the ‘Run’ option the same page will behave in a interactive way as shown below:
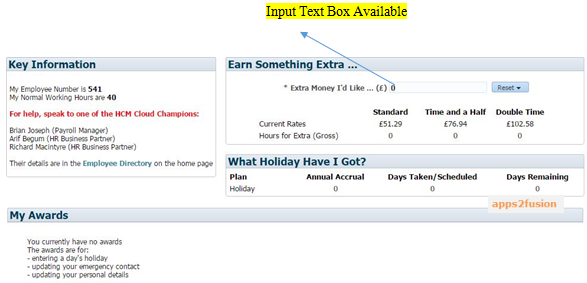
We would try to pass on a different value in the input box and hopefully there will be a new value for the fields (Hours for Extra (Gross))
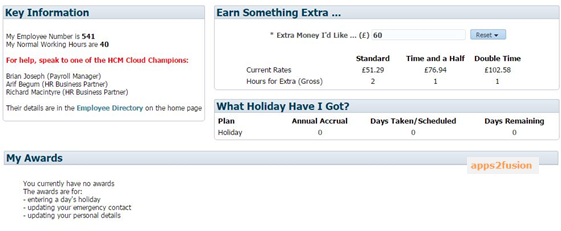
We provided a new value in Input Text box as (60) and it shows values of 2,1,1 for Standard , Time and a Half and Double Time Hours for Extra (Gross) income and with this we will conclude the topic with the hope that this article was useful and all of you would try to dig deep further into more detailed features to get a better grasp of the functionality offered.
Thank you, for your time and have a Great Day Ahead!!!!