This article explains the steps to configure Oracle Map viewer provided OBIEE_NAVTEQ dump is imported into your database with the required spatial data.
Datasources Configuration
1. Login to Mapviewer
2. Go to Manage Map Viewer -> Configuration
3. Enter the following connection information in “Config”
<map_data_source name="OBIEE_NAVTEQ"
jdbc_host="<host name>"
jdbc_sid="<sid>"
jdbc_port="<port>"
jdbc_user="<user>"
jdbc_password="!<password>"
jdbc_mode="thin"
number_of_mappers="3"
allow_jdbc_theme_based_foi="false"
/>
4. Click on Save and Restart.
Map Tile Layers
After configuring the datasource, map tile layers defined in the OBIEE_NAVTEQ schema will be available. We can create new map tile layers for Google, Navteq, Oracle E-Location etc.
1. Go To “Create Tile Layers”
2. “Select Type of Map Source” as “Google Maps” and click on “Continue”
3. Select “OBIEE_NAVTEQ” in datasource
4. Enter the google api key in “Key”.
Note: Follow the instructions on https://developers.google.com/maps/documentation/javascript/tutorial to get the google maps API key.
5. Click on “Submit”.
6. Go to “Manage Tile Layers” -> Select “Google_map” and click on “Bring Online”.
7. Go To “Create Tile Layers”
8. “Select Type of Map Source” as “Oracle Maps” and click on “Continue”
9. Select “OBIEE_NAVTEQ” in datasource and click on submit.
10. Go to “Manage Tile Layers” -> Select “eLocation_map” and click on “Bring Online”.
With the above steps, the mapviewer configuration will be complete.
OBIEE Analytics Configuration
Configure Layers
Themes have to be imported from the configured OBIEE_NAVTEQ datasource as Layers. After importing themes, you can associate certain layers with columns in the Oracle Business Intelligence subject area folders. If the association between a column and a layer is incorrect, then the layer cannot be displayed correctly on the map.
A BI layer can be associated with multiple columns in multiple subject areas. You must ensure that a layer is associated with at least one spatial column. If the layer association is missing, then the map might not be updated when a user drills on the mapped BI column.
The below steps explains the way to import default themes from OBIEE_NAVTEQ.
1. Login to OBIEE Analytics.
2. Go to Administration -> Manage Map Data.
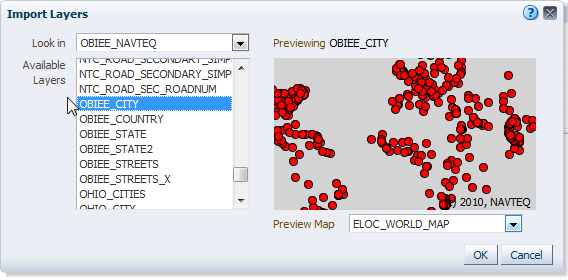
3. Click on “Import Layers” .
4. Select “OBIEE_NAVTEQ” in “Look in” and select “OBIEE_COUNTRY” in “Available Layers” and click on “OK”.
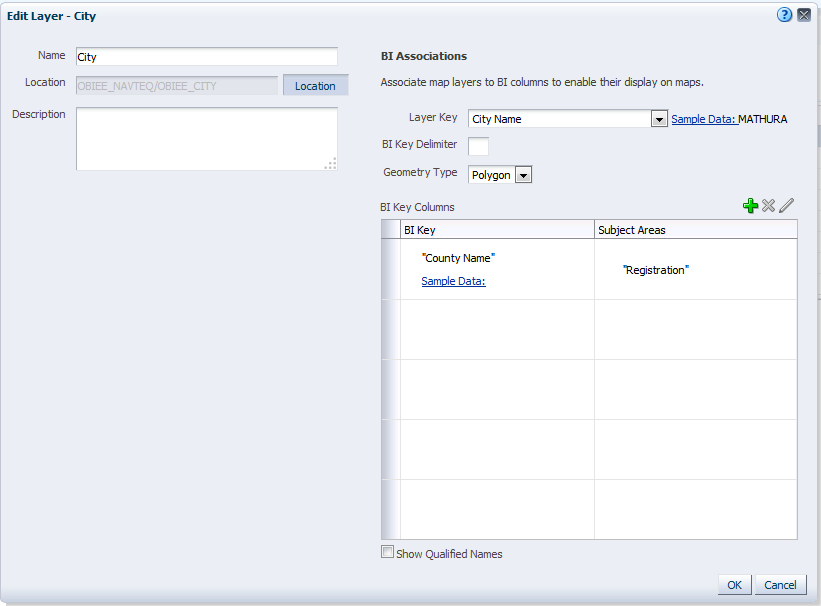
5. Now, Select the created layer and click on “Edit” .
6. Change the “Name” to “Country”, “Layer Key” to “Country Name(Init)” and select the “BI Key” Example: “Registration”.”Geography”.”Country Name”.
7. Similarly, Import Layers for District on OBIEE_NAVTEQ.OBIEE_STATE select it from the available layers.
8. Similarly, Import Layers for Council on OBIEE_NAVTEQ.US_COUNTIES
9. Import Layers for City on OBIEE_NAVTEQ.OBIEE_CITY as per the below screenshots.
Once the layers are created, Background Maps needs to be configured.
Configure Background Maps
In the Edit Background Map dialog, you assign each layer a minimum and maximum zoom range.
1. Go to Background Maps tab
2. Import the “OBIEE_WORLD_MAP” from OBIEE_NAVTEQ source.
3. Add the BI layers and Edit the Zoom Levels by clicking on Edit button for the selected background map.
4. Similarly, create the layers and edit the zoom levels for Google and e-Location maps.
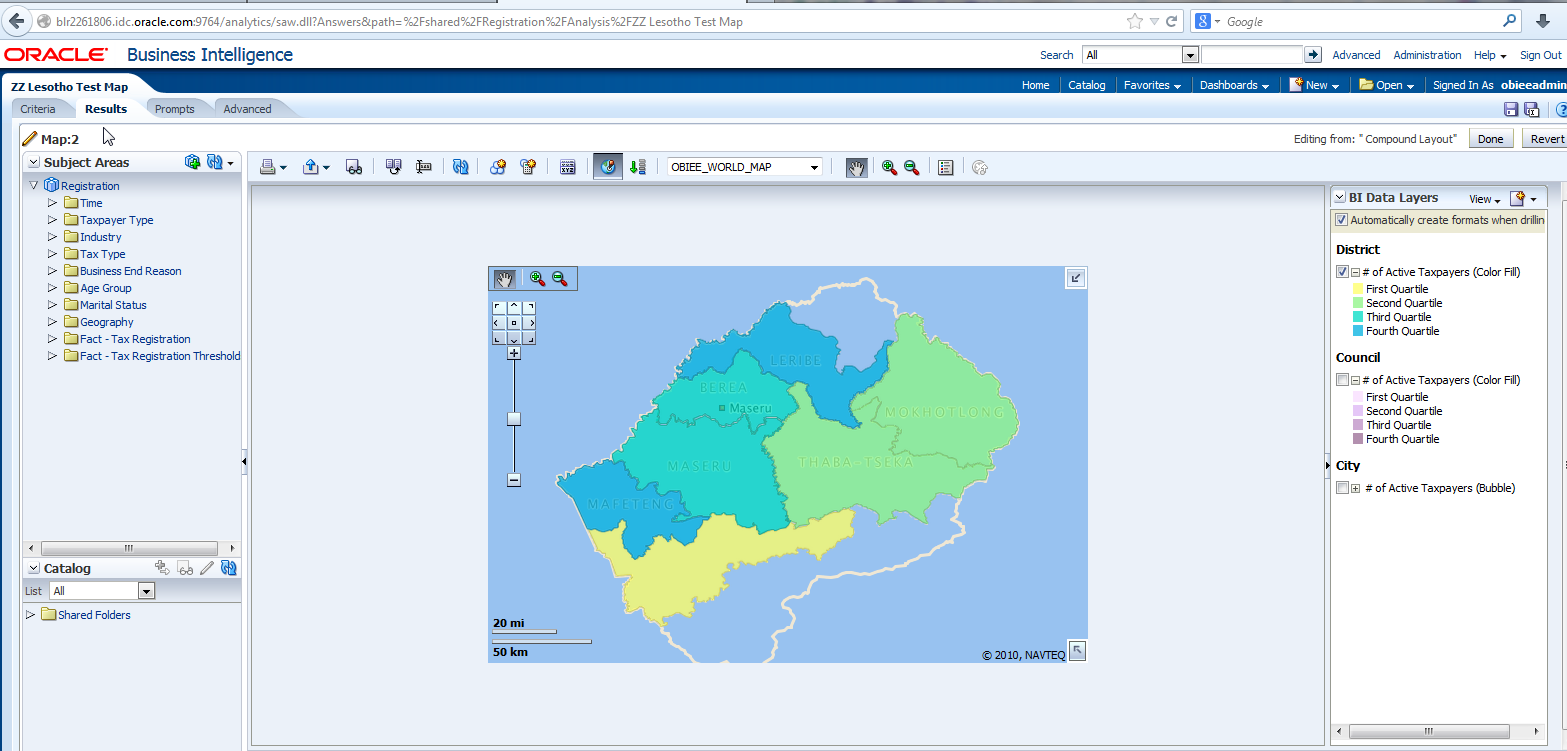
Sample Map Creation
1. Go to New -> Analysis -> Any Subject area
2. Select Geography. Tax area Name and any measure in the criteria.
3. Create a Map View and edit the view
4. Select “OBIEE_WORLD_MAP” or “Google Maps” or “e-Location Maps” from the drop down.
5. Create Formats by adding Map Formats